
Software

Type 7767 Pulse Data Manager

This software enables any measurements made using PULSE™LabShop to be labelled with metadata and saved to a database. This safe and orderly data storage gives access to the data across an organization – and even spanning the world.
Efficient searching and inspection helps you find specific datasets and analyses, enabling efficient data comparison and calculations across similar projects. Built-in, automated reporting tools enable fast and efficient production of reports.
USE SCENARIOS
- Archiving data for use with BK Connect and PULSE LabShop
- Centrally organizing data of multiple PULSE users in an organization, for comparing and sharing data and analysis results
- Searching for and retrieving test data for display, comparison, additional calculation and reporting
- Creating live reports quickly and efficiently
USE
Even with large amounts of data from many analyzers and many channels, saving data is a single-click operation. You can label the data or even a whole analysis project with any information on operator, location, test type, model, etc., and then save it along with any type of annotation such as pictures or reports.
With correctly labelled data, you can search for and retrieve all measurements made over time at a specific measurement point, such as on all vehicles of a specified type.
CAPABILITIES
- Allows customized databases
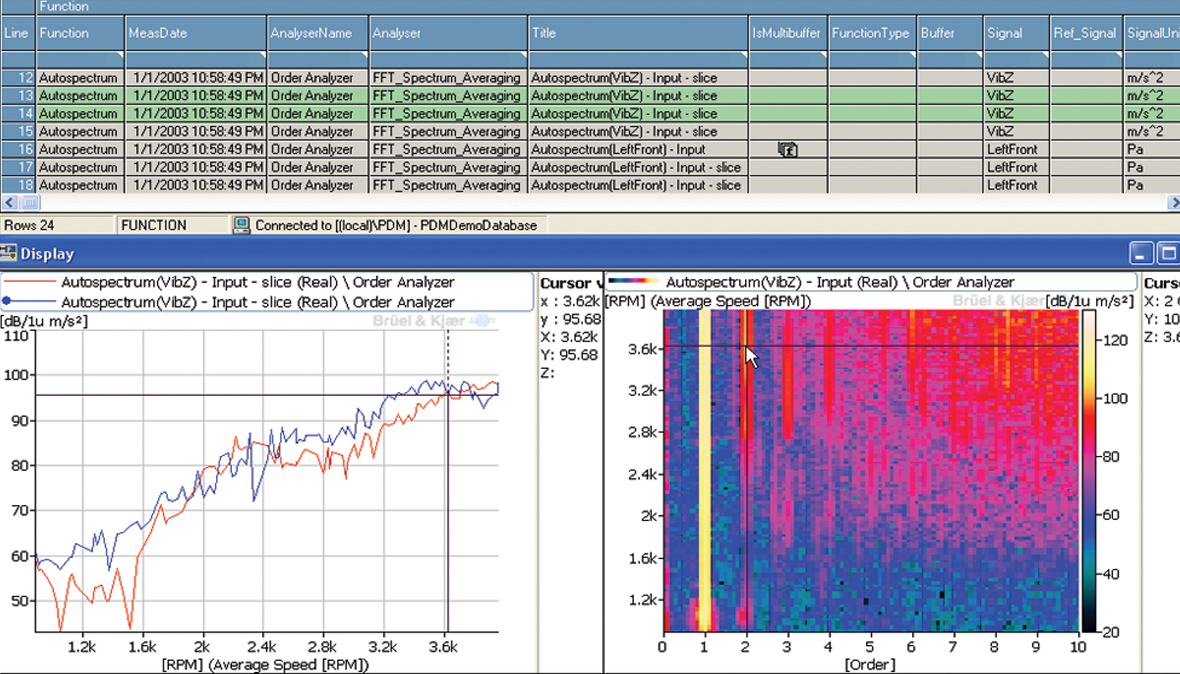
- Advanced display functionality including 3D displays and metadata-based legends
- Drag-and-drop graphical displays of measurement and analysis results, and overlay curves for easy data comparison
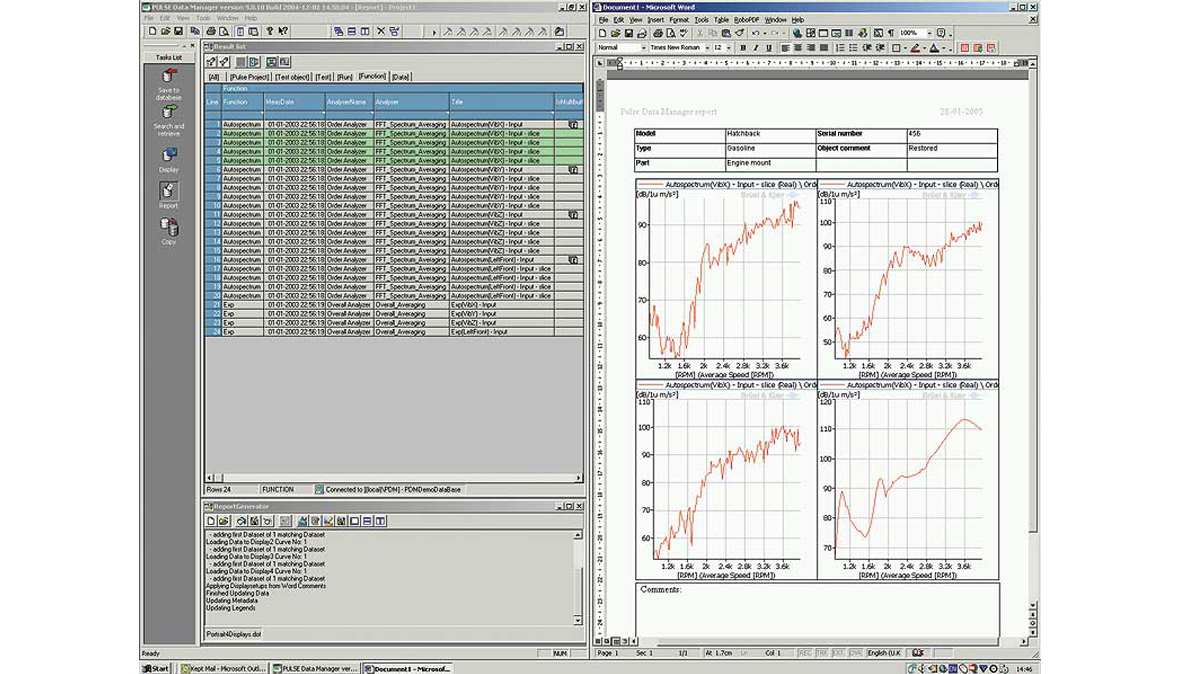
- Simple, intuitive reporting using Microsoft® Word templates
- Advanced customized reporting in the layout of your choice, using Microsoft® Word, Microsoft® Excel® or Microsoft® PowerPoint®
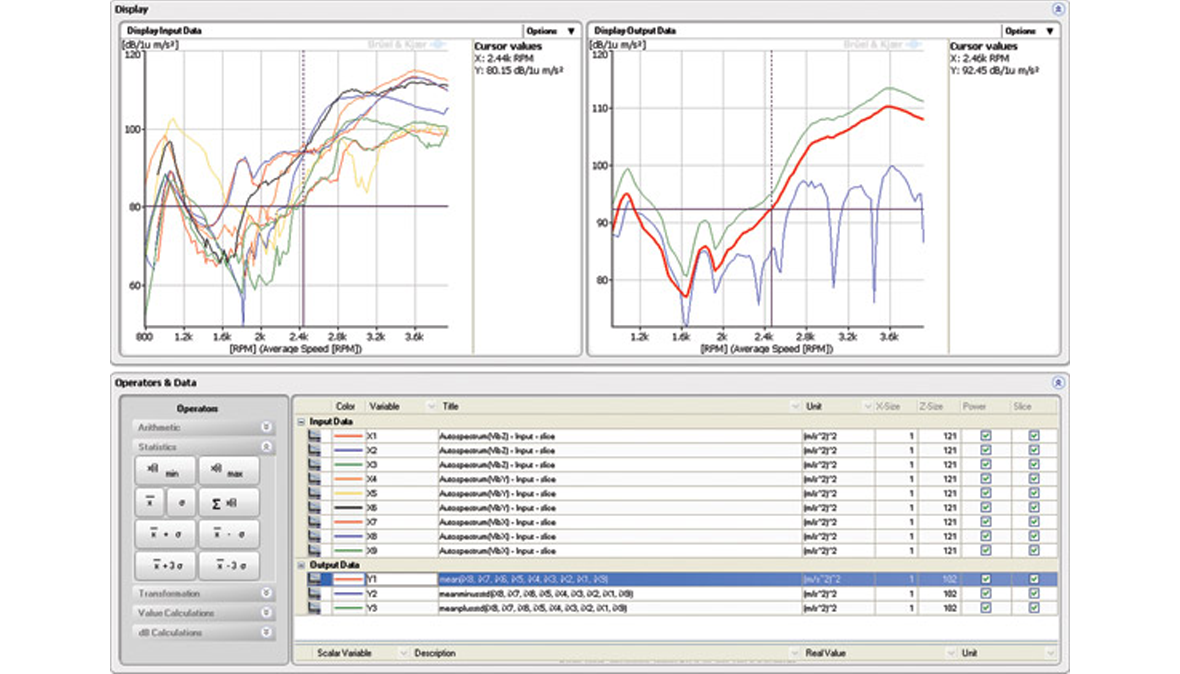
- Calculator tool provides dynamic post-processing, and arithmetical and statistical calculations of data
- Supports Microsoft® SQL Server®
SIMPLE AND AUTOMATED REPORTING
PULSE Data Manager allows you to drag-and-drop data into live displays in Microsoft® Word reports, which feature active cursors and cursor values. You have full access to graph properties, to change axis scaling, or add annotations. You can also add more curves to a report at a later date, avoiding the recreation of the entire report – simply open an existing report and add more data.
Reporting can be automated using the built-in report generator feature.


