Software

Perception High Speed DAQ Software

Perception Software: Reliable Data Acquisition at High Speed
The Perception software is designed for fast and reliable processing of large amounts of data and is therefore ideal for high-speed data acquisition. Thanks to the patented StatStream technology Perception enables 10 gigabytes of data to be visualized on your PC in 10 seconds. For your measurement, this means: Reliable storage and flexible real-time display as well as immediate review. You can access saved data even while measurements are running and zoom in on these data. Recording continues in the background.
Another highlight offered by Perception software is absolute operational security. Reliable data storage and using stable software are enormously important, particularly when tests cannot be repeated or are difficult to repeat. A software crash and the resulting data loss would be extremely expensive, for example, in destructive materials testing or aircraft starts. Perception high-speed software has been designed precisely for these requirements and has been subjected to extensive testing.
Configure
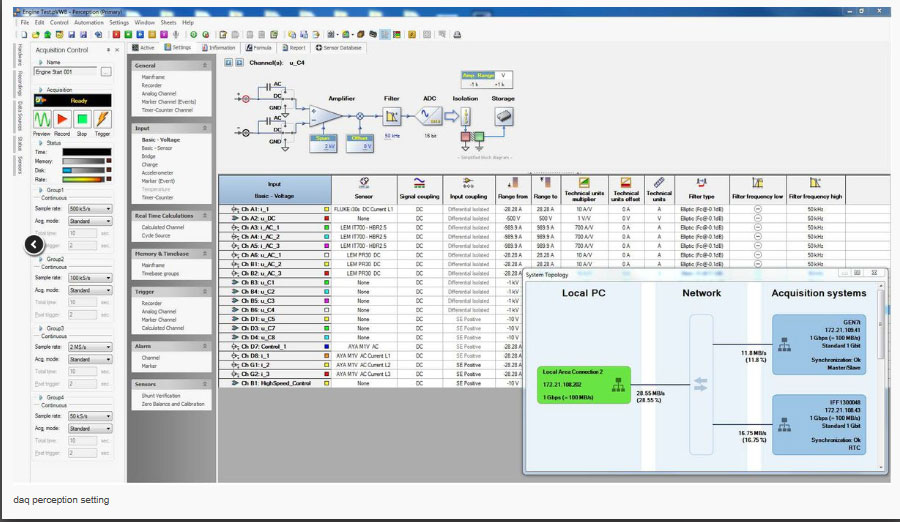
- Immediately ready for use – without any programming
- Sensor database ensures easy setup
- Configure channels individually, in groups, or by EXCEL import
- Password protection of sensitive settings
Display
- Patented, extremely fast visualization of large amounts of data
- Display of any number of visualization windows with Trend, Scope, x/y, FFT, and Meter
- Powerful multiple zoom functions and up to seven cursors
- Review while recording – analysis while the measurement is running
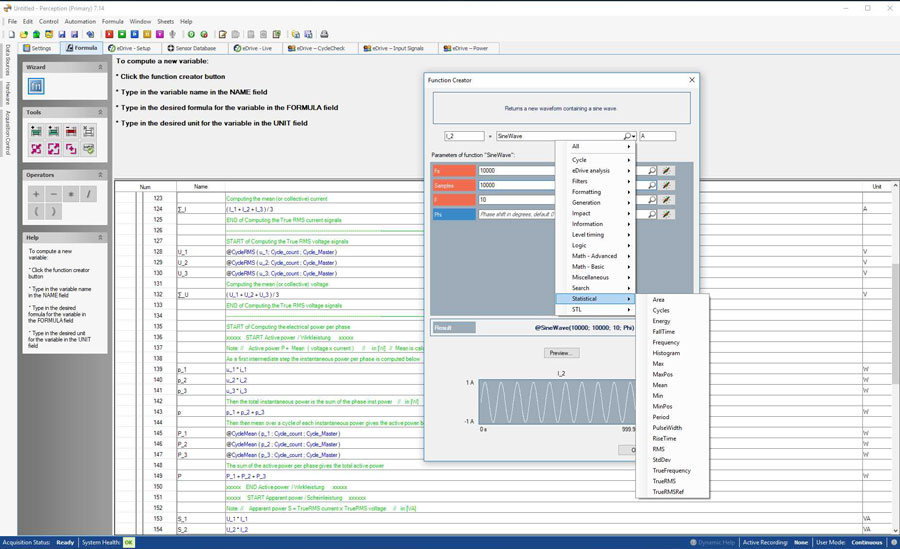
Compute & Analyze
- Real-time or post-process computation
- Over 150 analysis functions ranging from statistics through filters to FFT
- Analyses in any sequence
- IF…THEN decisions integrated in the analysis process
Save & Store
- Extremely fast storage with up to 400 MB/s on hard disk
- Storage on Linux RAID arrays or iSCSI data server for 100% data security
- Separate and/or collective storage and loading of device settings, formulas, report layouts, etc.
Document
- “One-click” transfer of computed results or cursor values to Excel
- Integrated report generator
- Quick Report enables “one-click” transfer of graphs and tables to Word
- Advanced Reporting allows the preparation of complete, conclusive reports in Word
Automate
- User keys and macros facilitate automated testing and analysis sequences
- Automated export, analysis, or report generation after the measurement
- Batch processing of thousands of measurements with cross-measurement reporting
- HBM Push: Define events to be notified by push messages to your mobile device
From Configuration to Automation: Perceptions Versatile Features
Configure: All amplifiers are displayed in a table where they can be configured

Display: Any number of different visualization windows can be combined and displayed across multiple monitors
Compute & Analyze: Over 150 functions are available and allow the customization of formulas and analysis
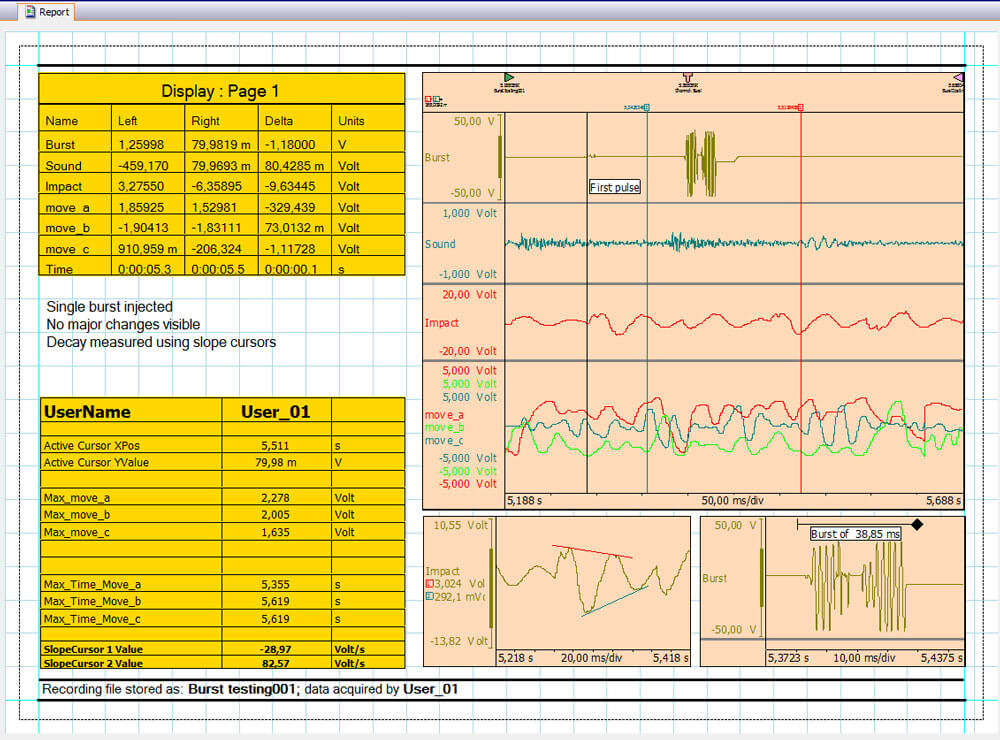
Document: Multi page reports can be created with displays, tables, user text and word alike formatting options
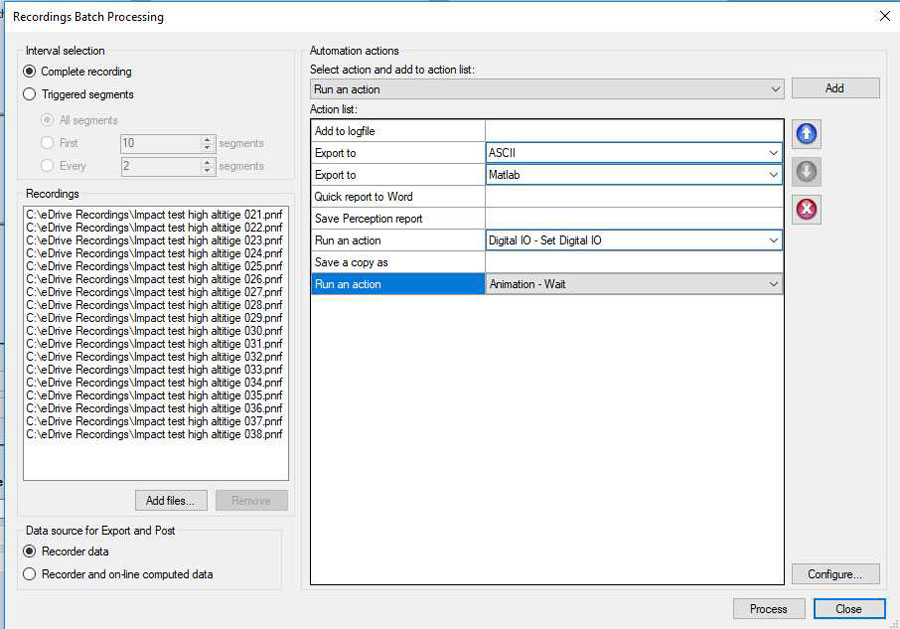
Automate: Entire measurement campaigns can be automatically saved, analyzed, exported, etc.